Results
Part 1. Relationships between measured soil physical factors and root density
Bulk Density
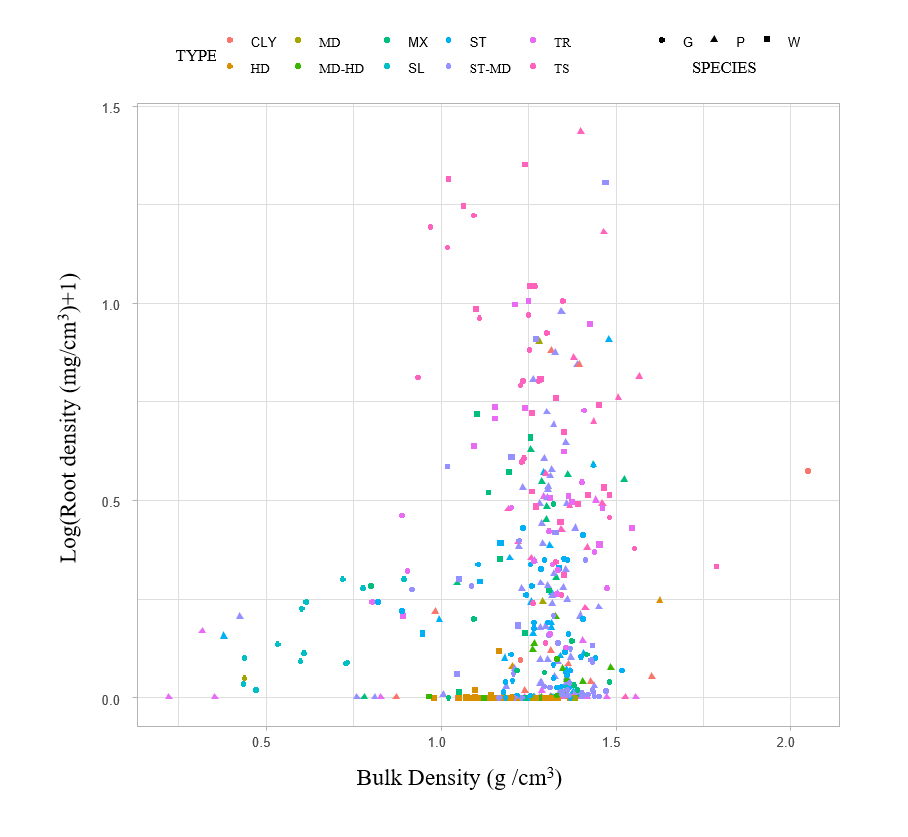
Figure 6. The log of rooting density (g cm-3 ) +1 in relation to bulk density (g cm-3). Types are content descriptions of each section and are colour coded represent by: CL(clay); SL(soil); MX(phosphogypsum and soil mix); TS(topsoil); TR(transition zone between topsoil and phosphogypsum); ST(soft phosphogypsum); ST-MD (soft to medium phosphogypsum): MD (medium phosphogypsum); MD-HD (medium to hard phosphogypsum); HD(hard phosphogypsum). Cores taken in the specific vegetation type are denoted by the shapes representing: G(grass); W(willow); P(poplar).
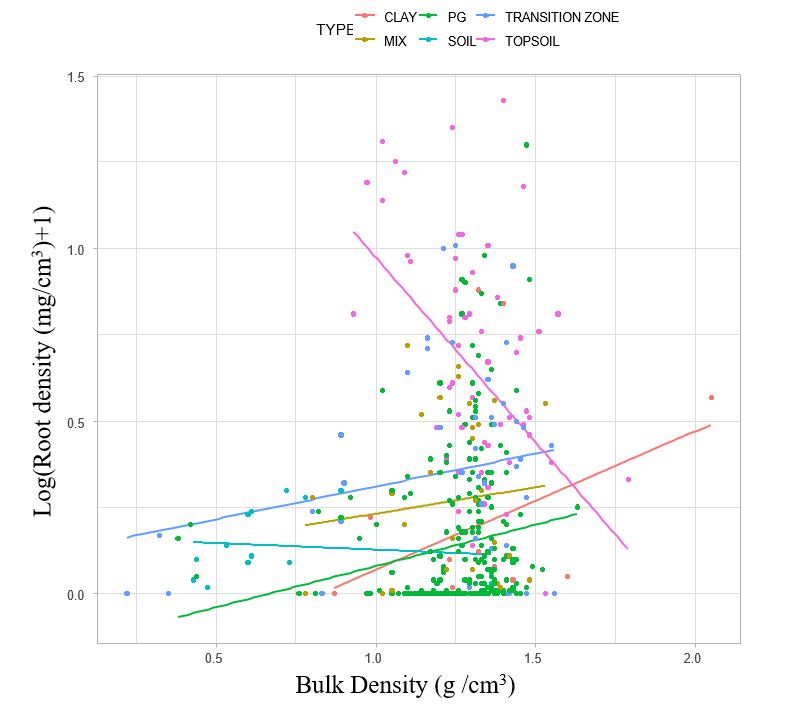
Figure 7. The log of rooting density (g cm-3 ) +1 in relation to bulk density (g cm-3) with corresponding regression lines representing the relationships seen in Table 6. Types are content descriptions of each section and are colour coded represent by: CLAY; SOIL; MIX(phosphogypsum and soil); TOPSOIL; TRANSITION ZONE(transition between topsoil and phosphogypsum); PG(phosphogypsum).
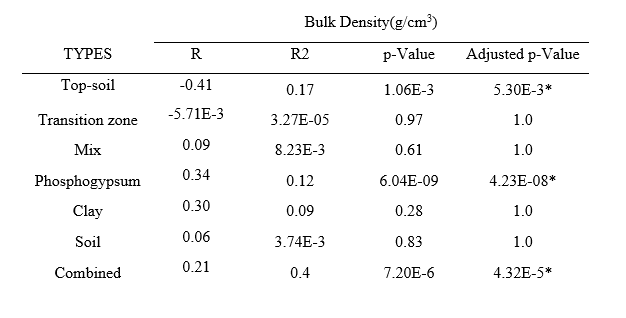
Table 6. R, R2, and corresponding p-Value calculated using the spearman correlation method and the adjusted p-Value using the Holm-Bonferroni method of the log of rooting density (g cm-3 ) +1 in relation to bulk density (g cm-3). Types were measured independently and consisted of topsoil, transition zones, mix(soil and phosphogypsum), clay, soil, and combined values for all measurements regardless of type. All significant values are denoted with * with an alpha level of 0.05.
Volumetric water content
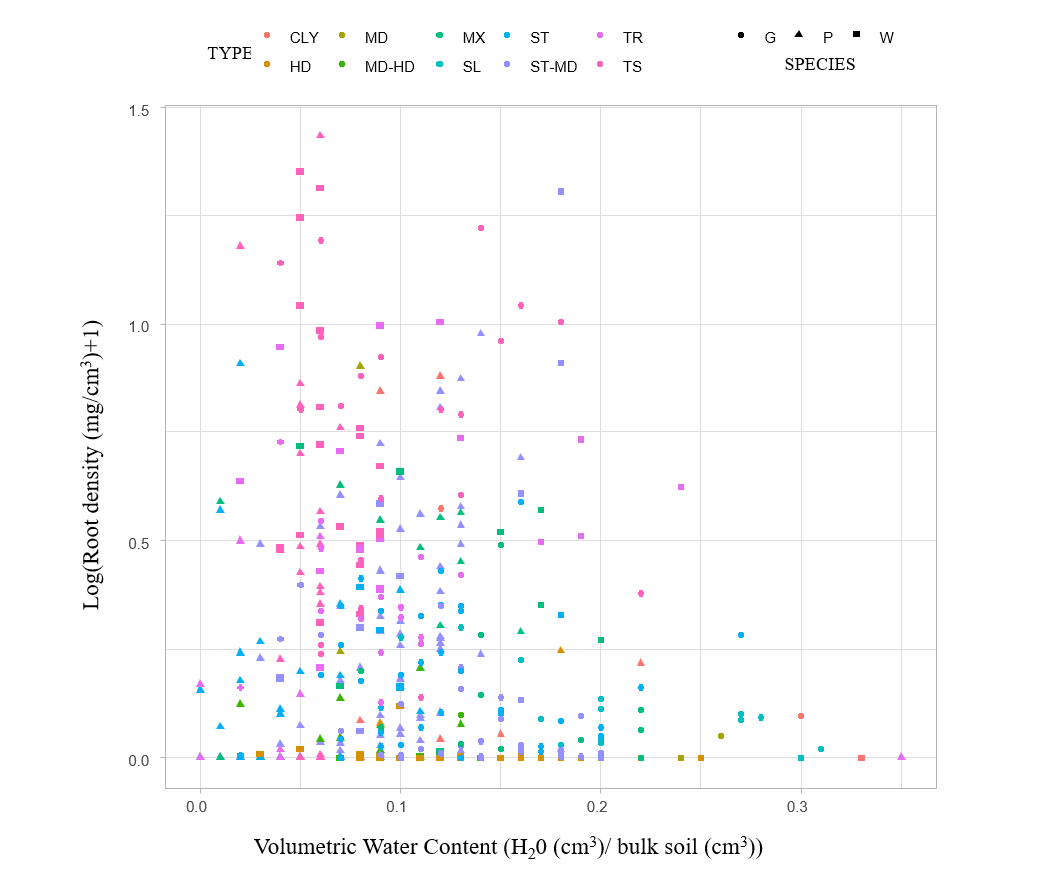
Figure 8. The log of rooting density (g cm-3 ) +1 in relation to volumetric water content (H20 (cm3)/ bulk soil (cm3). Types are content descriptions of each section and are colour coded represent by: CL(clay); SL(soil); MX(phosphogypsum and soil mix); TS(topsoil); TR(transition zone between topsoil and phosphogypsum); ST(soft phosphogypsum); ST-MD (soft to medium phosphogypsum): MD (medium phosphogypsum); MD-HD (medium to hard phosphogypsum); HD(hard phosphogypsum). Cores taken in the specific vegetation type are denoted by the shapes representing: G(grass); W(willow); P(poplar).

Figure 9. The log of rooting density (g cm-3 ) +1 in relation to volumetric water content (H20 (cm3)/ bulk soil (cm3) with corresponding regression lines representing the relationships seen in Table 7. Types are content descriptions of each section and are colour coded represent by: CLAY; SOIL; MIX(phosphogypsum and soil); TOPSOIL; TRANSITION ZONE(transition between topsoil and phosphogypsum); PG(phosphogypsum).
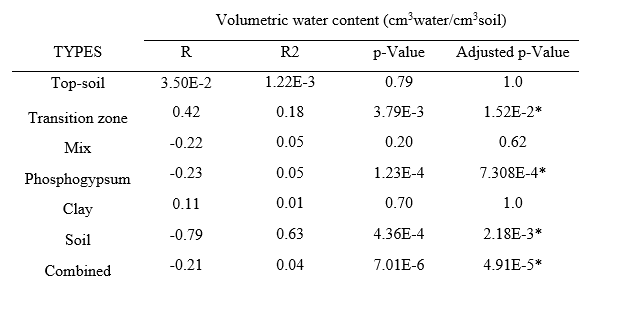
Table 7. R, R2, and corresponding p-Value calculated using the spearman correlation method and the adjusted p-Value using the Holm-Bonferroni method of the log of rooting density (g cm-3 ) +1 in relation to volumetric water content (H20 (cm3)/ bulk soil (cm3)). Types were measured independently and consisted of topsoil, transition zones, mix(soil and phosphogypsum), clay, soil, and combined values for all measurements regardless of type. All significant values are denoted with * with an alpha level of 0.05.
Air-filled Porosity
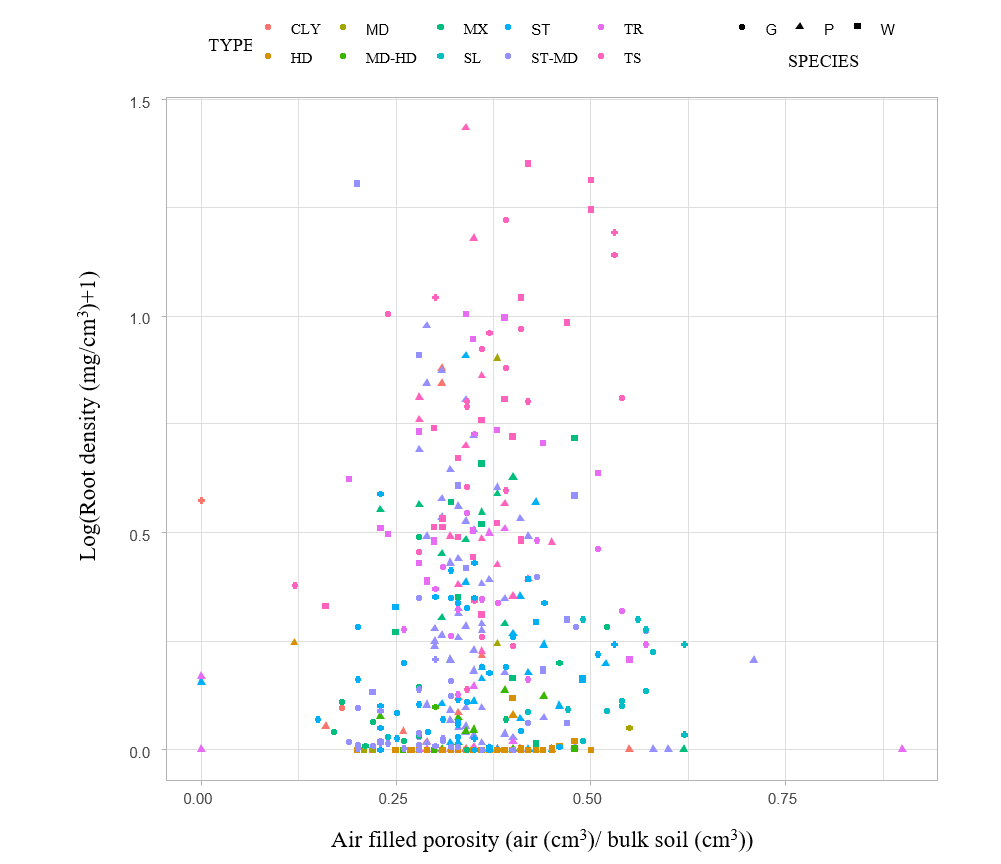
Figure 10. The log of rooting density (g cm-3 ) +1 in relation to Air-filled Porosity (air (cm3)/ bulk soil (cm3)). Types are content descriptions of each section and are colour coded represent by: CL(clay); SL(soil); MX(phosphogypsum and soil mix); TS(topsoil); TR(transition zone between topsoil and phosphogypsum); ST(soft phosphogypsum); ST-MD (soft to medium phosphogypsum): MD (medium phosphogypsum); MD-HD (medium to hard phosphogypsum); HD(hard phosphogypsum). Cores taken in the specific vegetation type are denoted by the shapes representing: G(grass); W(willow); P(poplar).
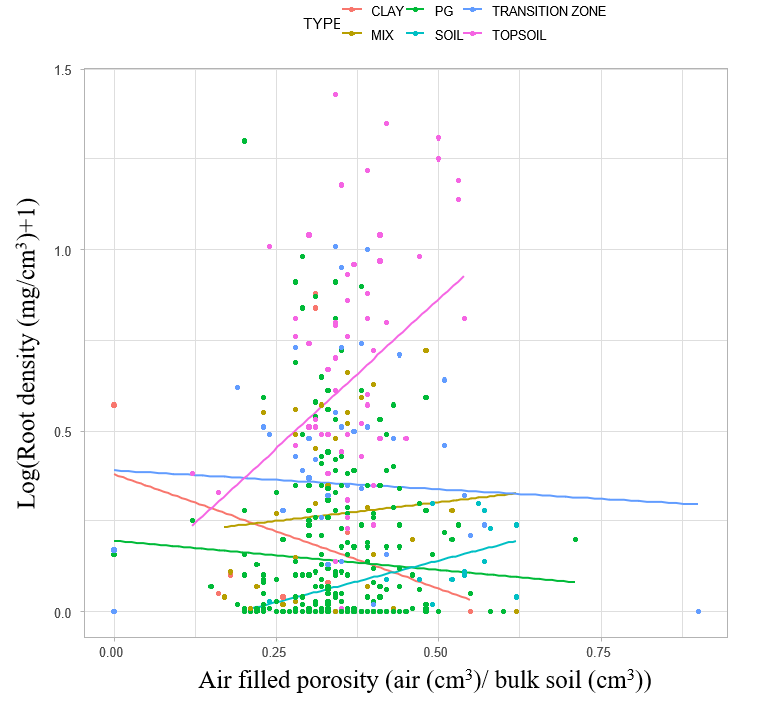
Figure 11. The log of rooting density (g cm-3 ) +1 in relation to Air-filled Porosity (air (cm3)/ bulk soil (cm3)) with corresponding regression lines representing the relationships seen in Table 8. Types are content descriptions of each section and are colour coded represent by: CLAY; SOIL; MIX(phosphogypsum and soil); TOPSOIL; TRANSITION ZONE(transition between topsoil and phosphogypsum); PG(phosphogypsum).
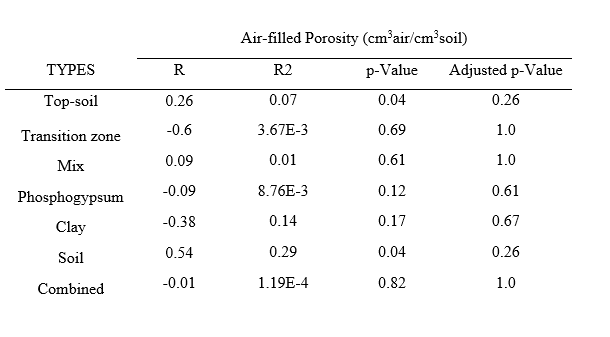
Table 8. R, R2, and corresponding p-Value calculated using the spearman correlation method and the adjusted p-Value using the Holm-Bonferroni method of the log of rooting density (g cm-3 ) +1 in relation to Air-filled Porosity (air (cm3)/ bulk soil (cm3)). Types were measured independently and consisted of topsoil, transition zones, mix(soil and phosphogypsum), clay, soil, and combined values for all measurements regardless of type. All significant values are denoted with * with an alpha level of 0.05.
Discussion
In Figure 6., the bulk density values can be seen to fall primarily between 1 and 1.5 regardless of type or whether the cores were taken in the different vegetated areas. In the regression analysis, Table 6., the correlation coefficients are shown using the spearman method and I was able to observe that there is a slight correlation between topsoil, phosphogypsum, and the overall combination of treatments regarding root density and bulk density, even after adjusting for multiple inferences using the Holm-Bonferroni method (Rice, 1989). Topsoil showed a weak negative correlation, as seen in Figure 7., which is unexpected since studies such as Shen et al. (2016) have shown that root density is inversely related to increasing bulk density. This negative correlation is primarily due to machinal root impedance, which stops roots from being able to go directly into the soil and is also associated with compaction (Centenaro, 2018). However, the phosphogypsum showed a positive correlation which may suggest that the material's structure plays a vital role in allowing roots to establish into the material. Increasing bulk density within the phosphogypsum may decrease the material's propensity to move within the stack due to downward water infiltration and increase its stability, however, little roots were found going above a bulk density of 1.5g/cm3.
For volumetric water content, Figure 7., the highest root densities were between 0.05 and 0.2 (H20 (cm3)/ bulk soil (cm3)), while in Figure 8., we can see positive trends between the topsoil and transition zone in regards to increasing water content and a negative trend in regards to phosphogypsum. The regression analysis, seen in Table 7. and using the same methods used for the bulk density data, show that there are significant relationships between water content in the transition zone, the soil below the transition zone, phosphogypsum, and all observed values. The relationships may be indicative of either water logged material values for the negative correlations or optimum water contents for the positive correlations.
Looking at Figure 10., I can see that air-filled porosity for most samples falls between 0.25 and 0.50 (air (cm3)/ bulk soil (cm3)). In Figure 11., there seems to be a steep regression line for topsoil; however, after adjusting for multiple inferences, see Table 8., there is no significant value p-value (>0.05), for topsoil or for any of the types measured in the core. These results suggest that bulk density and volumetric water content are the main drivers for root density rather than air-filled porosity, which is often determined as a combination of both factors.
Part 2. Above-ground biomass is related to bulk density and water potential
Seedling Growth
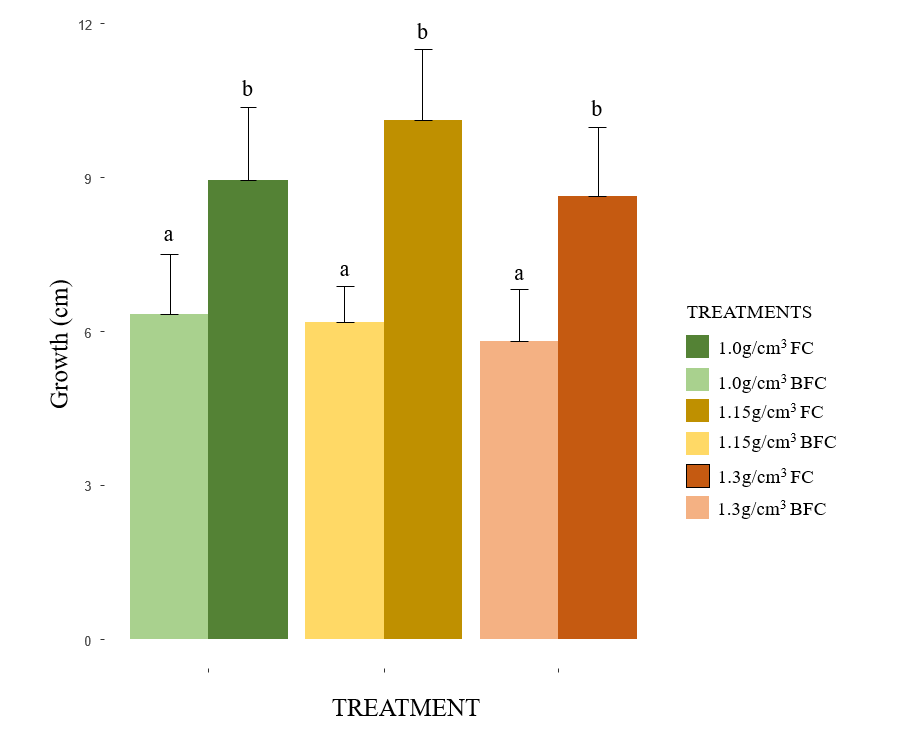
Figure 12. Bar chart representing growth(cm) of Populus balsamifera in relation to the six different treatments of 1.0, 1.15, and 1.3 bulk density (g cm-3) at the two water potentials of FC(field capacity -13.79kPa) and BFC(below field capacity -51.71kPa). Letters show the differences between all individual treatments.
|
Table 9. ANOVA table for GRWTH(growth(cm)) and the effects of both BLKDN(bulk density(g cm-3) and WP(water potential
(-kPa)). 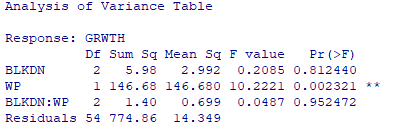
|
Discussion
The bar chart representing growth in Figure 12 clearly shows that water content at field capacity influences the height of Populus balsamifera, with an average increase of 3.13cm compared to seedlings grown in water contents below field capacity. This difference is also substantiated by Table 9. ANOVA results showing that water potential significantly affects height (p<0.05). These results were expected since soils at field capacity are the optimum water content for plant growth (Yu et al., 2007). |
Above-ground Biomass
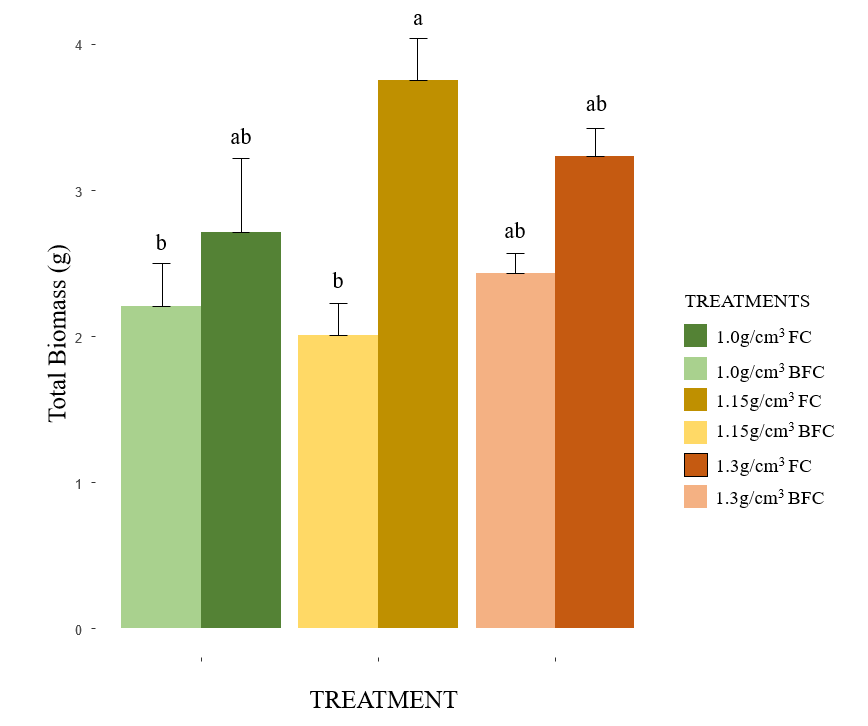
Figure 13. Bar chart representing total above-ground biomass(g) of Populus balsamifera in relation to the six different treatments of 1.0, 1.15, and 1.3 bulk density (g cm-3) at the two water potentials of FC(field capacity -13.79kPa) and BFC(below field capacity -51.71kPa). Letters show the differences between all individual treatments.
|
Table 10. ANOVA table for TBM(total above-ground biomass(g)) and the effects of both BLKDN(bulk density
(g cm-3) and WP(water potential (-kPa)). 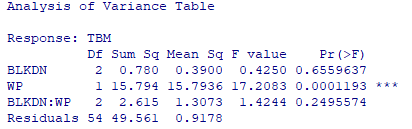
|
Discussion
Total biomass in relation to bulk density and water potential can be seen in Figure 13, showing that the treatments do not differ regarding water potentials at field capacity. However, ANOVA results, Table 10., showed there was a significant difference (p<0.05) in total biomass with water potential. |
Caliper and Leaf Area
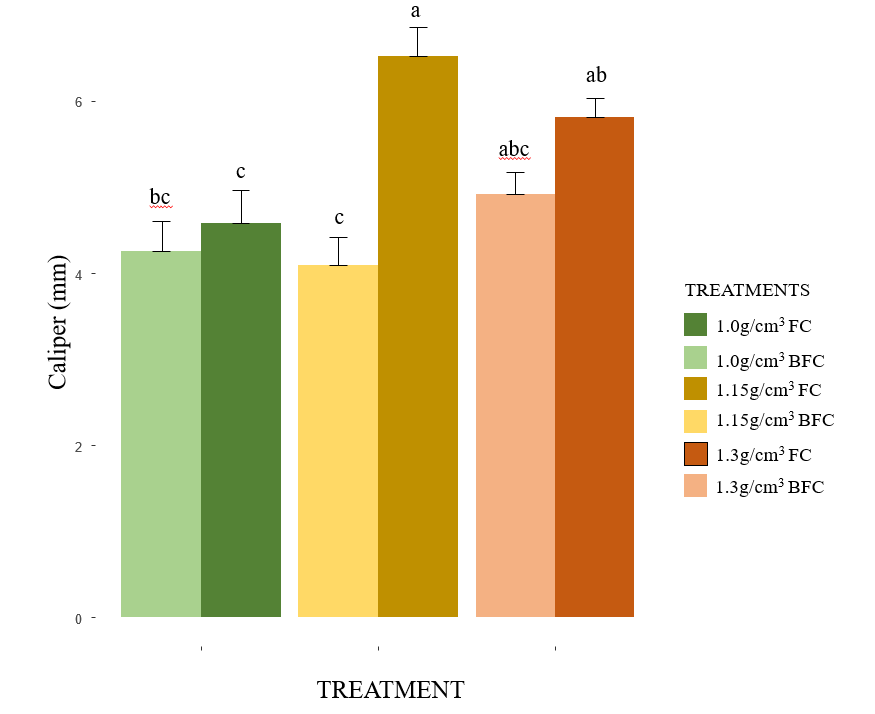
Figure 14. Bar chart representing caliper(mm) of Populus balsamifera in relation to the six different treatments of 1.0, 1.15, and 1.3 bulk density (g cm-3) at the two water potentials of FC(field capacity -13.79kPa) and BFC(below field capacity -51.71kPa). Letters show the differences between all individual treatments.
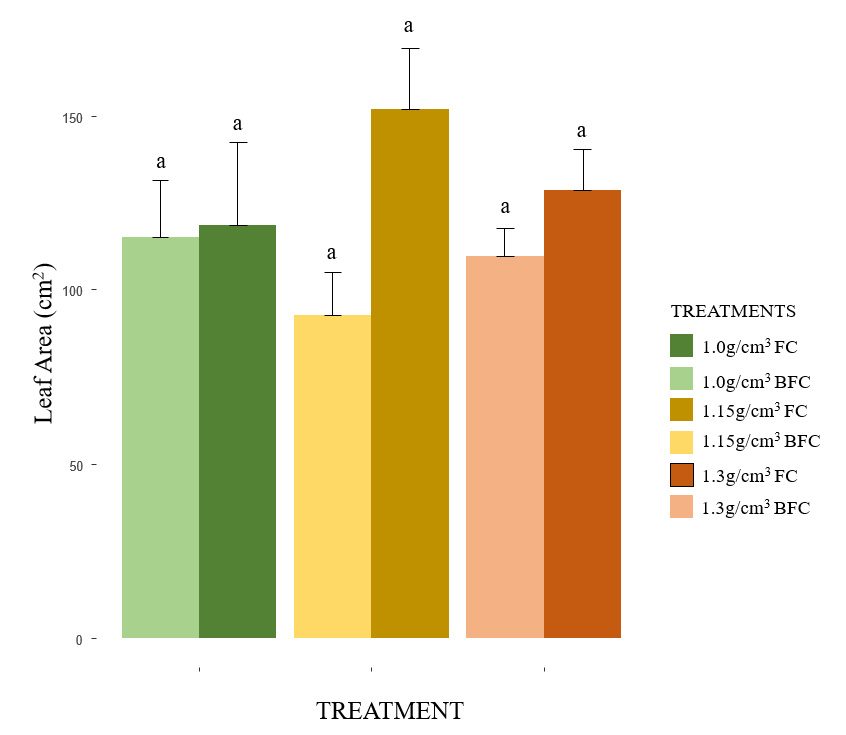
Figure 15. Bar chart representing leaf area(cm2) of Populus balsamifera in relation to the six different treatments of 1.0, 1.15, and 1.3 bulk density (g cm-3) at the two water potentials of FC(field capacity -13.79kPa) and BFC(below field capacity -51.71kPa). Letters show the differences between all individual treatments.
|
Table 11. ANOVA table for CAL(caliper(mm)) and the effects of both BLKDN(bulk density(g cm-3) and WP(water potential
(-kPa)). 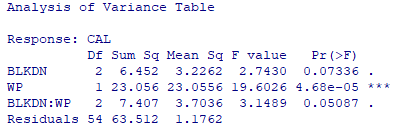
Table 12. ANOVA table for LA(leaf area(cm2)) and the effects of both BLKDN(bulk density(g cm-3) and WP(water potential
(-kPa)). 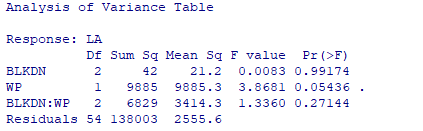
|
Discussion
The caliper measurements, as seen in Figure 14., have varying levels of differences between each treatment. The ANOVA results, Table 11., again show that water potential (p<0.05) is the main driver of the variation between the caliper measurements. For leaf area, Figure 15., there is no difference within or between treatments. The ANOVA results for leaf area, Table 12., also show that there is no relationship between either bulk density or water content (p>0.05). |
Conclusion
The relationships that can be established from this research regarding the physical parameters of phosphogypsum and root propensity are both expected and unexpected. In the field study, the relationship between root density and bulk density of phosphogypsum showed a weak positive correlation and high significance (R=0.34, P<0.05), with increased bulk density relating to higher root abundance. In contrast, topsoil showed an expected result of decreased roots with increased bulk density (Shen et al., 2016). The volumetric water content also shows a negative correlation coefficient for all significant values suggesting that root density in the phosphogypsum is increased with decreased water content. These results were unexpected since roots are often associated with higher water contents, particularly at field capacity (Yu et al., 2007). An explanation of this result might have been related to the stability of the phosphogypsum within 85cm as measured in the core and might be decreased due to the high erodibility of the material (Rutherford, 1994), as well as it might be affected by the small soil capping depth used on the stack which may allow more water infiltration and erosion within the stack making it harder for roots to establish (Jackson et al., 2011). Therefore, the increase in volumetric water content may lead to less stable conditions for root development. The last result for air-filled porosity yielded no significant results after the Holm-Bonferroni adjustment, which suggests that roots are not affected by air-filled porosity of the phosphogypsum, and factors of bulk density and volumetric water content have more influence on root development within the stack.
An analysis of the above-ground measurements from the greenhouse experiment showed that water potential had the most significant effects on growth, total biomass, and caliper while not affecting leaf area. The results also indicated that bulk density did not have any effect on any of the above-ground measurements, suggesting that bulk density does not affect the above-ground vitality if Populus balsamifera. From a biological standpoint, these results were expected for water potential since soils at field capacity are considered optimum for plant growth, with plants grown in pots at field capacity having higher overall measurements in all categories except leaf area. However, the increase in water content directly conflicts with results found from analyzing the volumetric water content within the cores suggesting that controlled conditions may not be fully related to field conditions.
These results will hopefully aid stack closure development plans regarding phyto-caps. Taking premeasurement cores before planting various vegetation types may help to understand how far roots will be able to establish into the stack, while measures such as decreasing the bulk density through ripping processes may help with root infiltration deeper into the stack. The ability for roots to penetrate deeper into the stack can then aid in increased water uptake deeper into the stack as plants develop. Based on the greenhouse results, premeasurements before planting trees may also help in the timing of vegetation establishment, with planting commencing when the phosphogypsum has a higher water potential than when dry which may increase the overall above-ground growth of trees while trees are still developing. Overall, this research has aimed to give more knowledge on the rooting behavior, distribution, and above-ground vitality of vegetation in relation to physical parameters of phosphogypsum which may help closure plans considering using a phyto-cap better predict the rooting propensity and establishment of vegetation using similar coring methods before vegetating a phyto-cap.
